
When you're trying to get a handle on employee absence, it's easy to fall into the trap of just counting the total days someone is off sick. But that number alone doesn't give you the full picture. The Sickness Bradford Factor is a tool that helps you look deeper.
It's built on a simple but critical idea: frequent, short-term absences are often far more disruptive to a business than a single, longer spell of sick leave. The goal isn't to penalise people for being ill, but to spot patterns that might need a closer look.
Understanding the Impact of Sickness Absence Patterns
Think about it this way. An employee who is off for two straight weeks for a planned operation is one thing. You can plan cover, redistribute work, and manage expectations. But what about an employee who takes ten separate Mondays off over the course of a few months? Even though the total days off are the same, the impact on the team is completely different.
That’s where the Bradford Factor comes in. It’s a formula that gives extra weight to the frequency of absences, highlighting how repeated, unplanned time off can throw a wrench in the works.
It's a bit like dealing with roadworks. One big, scheduled closure on a major route is a headache, but you can plan for it. Now, imagine a set of traffic lights on that same route failing randomly for an hour every few days. The constant, unpredictable disruption is what causes real chaos. The Bradford Factor treats those frequent, short absences as the unpredictable tremors that can really damage a team's momentum.
Why Focus on Frequency?
The logic is that the number of times someone is absent often tells you more than the total days they’ve been away. A high frequency of unplanned absences can be a flag for underlying issues that need attention. It could be pointing to:
- Low Morale: Unhappy or disengaged employees might be more inclined to take odd days off here and there.
- Stress and Burnout: Short, recurring absences can be an early warning sign that someone is overwhelmed by their workload or workplace pressures.
- Underlying Health Issues: Some chronic conditions lead to sporadic absences, and this pattern helps you see where supportive management is needed.
- Work-Life Challenges: Problems with childcare or other personal commitments can sometimes show up as frequent, short-term leave.
This infographic does a great job of showing how a pattern of frequent absences can quickly snowball, causing a major disruption to workflow.
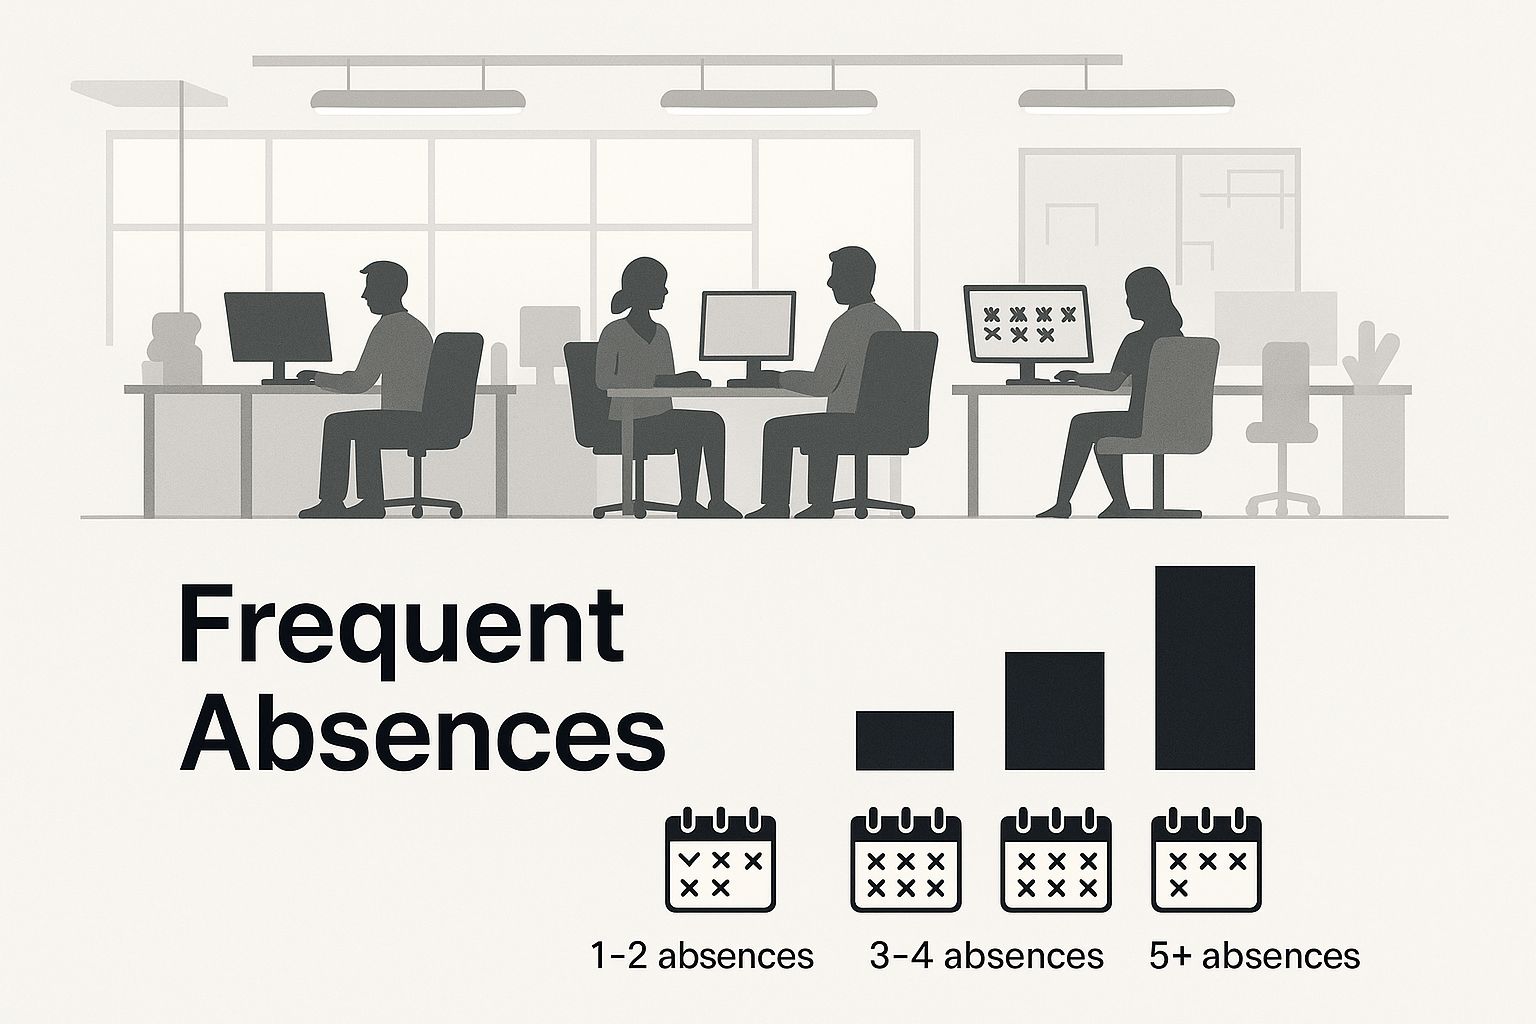
As you can see, it's the recurring nature of the time off, not just the length of each absence, that creates the real operational headache for a team.
Key Takeaway: The Bradford Factor isn't a blunt instrument for discipline. It’s a data-driven prompt. It flags patterns that suggest a manager should have a supportive conversation to understand the root cause, rather than jumping to conclusions.
Ultimately, a high score is simply an indicator for managers and HR. It’s a signal that it’s time to talk, offer support, make reasonable adjustments, or tackle any workplace issues before they become bigger problems. It shifts absence management from just counting days to understanding the story behind them.
How to Calculate the Bradford Factor Score

At first glance, the Bradford Factor might seem like a complicated HR metric, but the actual maths behind it is surprisingly simple. It’s a clever formula designed to turn raw absence data into a single score that tells a story about disruption.
The core formula is S² x D = B. Let’s break down what each part means in plain English.
- S stands for 'Spells': This is the number of separate times an employee has been off sick. A single day off counts as one spell. A consecutive five-day absence for the flu? That’s also just one spell.
- D stands for 'Days': This one’s easy – it’s the total number of individual days the employee was absent across all their spells.
- B is the Bradford Factor Score: This is the final number you get, which flags the overall impact of the absences.
The real magic happens with the S² part of the calculation. By squaring the number of spells, the formula places a much heavier emphasis on the frequency of absence. This is what causes the score to jump dramatically with each new, separate absence.
The Formula In Action
To see just how powerful this is, let's compare two employees. We’ll call them Alex and Ben. Both have been off for a total of 10 days over the past year, but the pattern of their absences couldn't be more different.
Scenario 1: Alex
Alex had one long stretch of sickness lasting 10 days. Maybe it was for a minor operation or a nasty bout of bronchitis.
- Spells (S) = 1
- Total Days (D) = 10
- Calculation: (1 x 1) x 10 = 10
- Alex's Bradford Factor Score is just 10.
Scenario 2: Ben
Ben was also off for 10 days, but his were all separate, single-day absences. Think of them as sporadic 'duvet days' or frequent sick calls on Mondays and Fridays.
- Spells (S) = 10
- Total Days (D) = 10
- Calculation: (10 x 10) x 10 = 1,000
- Ben's Bradford Factor Score is a whopping 1,000.
The difference is stark. Even though they lost the same number of workdays, Ben’s score is 100 times higher than Alex’s. This immediately highlights that Ben's pattern of frequent, short-term absences is far more disruptive to the business.
The table below gives you a quick visual comparison of how these two scenarios play out.
Bradford Factor Score Calculation Examples
This table compares how different absence patterns over a 52-week period result in vastly different Bradford Factor scores.
| Employee Scenario | Number of Absences (S) | Total Days Absent (D) | Calculation (S² x D) | Bradford Factor Score |
|---|---|---|---|---|
| Alex (One long absence) | 1 | 10 | (1 x 1) x 10 | 10 |
| Ben (Ten short absences) | 10 | 10 | (10 x 10) x 10 | 1,000 |
| Chloe (Three absences) | 3 | 5 | (3 x 3) x 5 | 45 |
| David (Two longer absences) | 2 | 12 | (2 x 2) x 12 | 48 |
As you can see, the score penalises frequency much more heavily than duration, providing a clear indicator of potentially problematic attendance.
Setting The Timeframe
For the Bradford Factor to be consistent and fair, you need to apply it over a specific timeframe. The universally accepted standard is a rolling 52-week (one year) period.
Using a rolling period is key. It means the score always reflects the most recent 12 months of an employee's attendance record. As a new week passes, the data from the oldest week drops off.
This approach ensures the score stays current and doesn't permanently hold a bad spell from over a year ago against an employee who has since improved. It makes the Bradford Factor a living, relevant tool for modern absence management. If you want to dig into more scenarios, have a look at our detailed guide to the Bradford Factor calculation.
Interpreting Scores and Setting Action Triggers
So, you’ve calculated a Bradford Factor score. What now? A number on its own is just that—a number. The real magic happens when you know how to interpret it and, more importantly, what to do about it. This is where setting clear "action triggers" turns a simple metric into a powerful management tool.
Most companies that get real value from the Bradford Factor don’t just passively track scores. They build a simple framework around them, defining specific thresholds that prompt a manager to step in. Think of it like a traffic light system for managing absence.
- Green: The score is low. No cause for concern here.
- Amber: The score is creeping up. This signals a potential pattern that’s worth an informal chat.
- Red: The score is high. This points to a significant issue with frequent absences that needs a more formal review.
This simple system creates a fair and predictable process. It ensures every employee is managed by the same standards, removing guesswork and inconsistency.
From Numbers to Conversations
Let’s be crystal clear: these triggers are not a fast track to disciplinary action. Their main job is to start a supportive conversation. A high score should be a prompt for a manager to ask, "Is everything okay?" not a prelude to handing out a formal warning.
This conversation is your chance to uncover the real story behind the absences. An employee hitting an amber or red trigger could be dealing with all sorts of things:
- An undiagnosed long-term health condition.
- Work-related stress or even burnout.
- Mental health challenges like anxiety or depression.
- Difficulties at home, like caring for a family member.
Without this chat, all you have is a number, which is easily misinterpreted. The trigger simply opens the door to understanding the human context behind the data. This allows you to offer genuine support, whether that’s making reasonable adjustments, referring them to occupational health, or exploring flexible working options.
The goal is to use the score as a conversation starter, not a disciplinary hammer. It flags an issue so you can offer support, not judgment.
This supportive approach has never been more critical. Just look at the NHS in England, where the sickness absence rate jumped from 4.3% in 2019 to 5.6% in 2022. Some NHS ambulance trusts saw rates as high as 10%. These figures, detailed in a Nuffield Trust analysis of sickness absence trends in the NHS, show the immense pressure organisations are under to manage wellbeing and attendance effectively.
Creating a Clear Framework
Setting clear trigger points is vital for fairness and transparency. There’s no universal "correct" set of thresholds—you should always tailor them to your company culture and industry—but a common structure gives you a solid place to start. Having defined levels helps managers act consistently and lets employees know exactly where they stand.
Here’s a sample table showing how different score ranges can be tied to specific, escalating actions.
Example Bradford Factor Trigger Points and Actions
This table provides a sample framework, illustrating how different score thresholds can trigger specific, escalating management actions.
| Bradford Factor Score Range | Risk Level | Recommended Management Action |
|---|---|---|
| 0 – 49 | Green (Low) | No action required. Continue routine monitoring. |
| 50 – 199 | Amber (Medium) | Manager initiates an informal, supportive chat during a return-to-work interview to understand the reasons for the absences and offer support. |
| 200 – 449 | Red (High) | A formal meeting is arranged to discuss the absence pattern in detail. This may involve HR and could lead to setting improvement targets or making formal adjustments. |
| 450+ | Red (Very High) | Triggers a more serious formal review process, which could include a final written warning if underlying issues are not addressed or patterns persist without valid reason. |
A structured approach like this ensures that your response is always proportional to the issue at hand. It stops managers from ignoring worrying patterns on one hand or overreacting to minor blips on the other. For a more detailed guide on setting these levels, check out our article on Bradford Factor trigger points, which offers more examples and best practices.
Ultimately, interpreting scores and using triggers is a balancing act. It’s about blending objective data with empathetic management to support your people while protecting the business.
Is the Bradford Factor a Friend or Foe?
The Bradford Factor is a powerful tool for managing absence, but it’s a bit like a sharp knife – incredibly useful in the right hands, but dangerous if used carelessly. Understanding its strengths and weaknesses is absolutely crucial if you’re thinking about bringing it into your organisation. Used thoughtfully, it can bring a new level of clarity and fairness to absence management. Applied rigidly, it can do more harm than good.
One of the biggest plus points is its objectivity. It strips away the subjective guesswork. No more relying on a manager’s gut feeling about whether an employee's attendance is becoming a problem. Instead, you get a consistent, data-driven score that’s the same for everyone, no matter which department they're in or who their line manager is. This goes a long way towards preventing unconscious bias.
It’s also beautifully simple. The formula isn’t some complex algorithm that only a data scientist could love. It’s straightforward enough for HR, managers, and even employees to grasp, which helps build trust and transparency around your absence policies.
The Real Strengths of the Formula
Where the Bradford Factor really shines is in spotting a pattern that's often missed: the sheer disruption caused by frequent, short-term absences. A simple tally of total days off just can't distinguish between one employee off for two weeks with a broken leg and another who has taken eight separate sick days over a few months. The first case is predictable and easier to plan around; the second creates a constant headache for scheduling and team workflow.
This gives managers a clear, factual starting point for a conversation. A rising score acts as an early warning signal, prompting a supportive check-in long before a minor issue spirals into a major concern for the employee’s wellbeing or the team’s performance.
By putting a number on the disruptive impact of frequent absences, the Bradford Factor empowers managers to tackle the root cause of a problem, shifting the focus from reactive fire-fighting to proactive support.
This proactive stance is more important than ever. Recent figures from the Chartered Institute of Personnel and Development (CIPD) show that the average number of sick days per employee in the UK has jumped from 5.8 in 2019 to 7.8 in 2023. That’s the highest it’s been in over a decade, with minor illnesses and mental health struggles being key reasons. You can dig into this further in the CIPD's report on rising sickness absence rates.
The Risks and Ethical Traps to Avoid
For all its benefits, the Bradford Factor comes with some serious caveats. The biggest criticism, and it's a valid one, is that it can unintentionally punish the most vulnerable people in your workforce. The formula is a blunt instrument; it can't tell the difference between someone skiving and someone having a flare-up of a long-term health condition.
This creates a real risk for employees dealing with:
- Chronic Illnesses: Conditions like asthma, migraines, or Crohn's disease often lead to unpredictable, short periods of absence.
- Disabilities: Staff with disabilities, who are protected under the Equality Act 2010, may naturally have more frequent, short absences related to their condition.
- Mental Health Challenges: Anxiety and depression don’t stick to a schedule. They can result in intermittent days off that send a Bradford score soaring.
- Caring Responsibilities: A parent with a sick child or someone caring for an elderly relative will inevitably face unplanned, short-term absences.
Blindly applying the formula in these situations isn't just unfair—it could land you in legal hot water for discrimination. A high Bradford score should never be a one-way ticket to a disciplinary hearing. Think of it as a signpost, not a verdict. It should trigger a supportive conversation to understand the story behind the numbers and make any reasonable adjustments. The tool is a compass to guide you, not an axe to swing.
How to Implement a Fair Bradford Factor Policy
Putting the Bradford Factor into practice is more art than science. If you just flick a switch on a calculator and start churning out scores, you're going to create more problems than you solve. A good rollout is all about fairness, being open with your team, and using the score as a tool to help people, not punish them.
The very first step? Talk to your people. Before you even think about tracking scores, you need to explain what the Bradford Factor is, why you're using it, and how it will work. Position it as part of a bigger picture – one that's about supporting everyone's wellbeing and making sure things are fair across the board. The goal is to spot disruptive patterns so you can offer support, not to penalise someone for being genuinely ill.
Make sure this conversation is thorough and that everyone gets it. Explain the formula, what the trigger points are, and exactly what happens if someone’s score hits a certain level. Being upfront like this takes the mystery out of it and stops the rumour mill from turning it into some kind of scary disciplinary monster. If you need a hand structuring your approach, our guide on creating a sickness and absence policy is a great place to start.
Get Your Managers Ready to Talk, Not Just Tally
Your line managers are the face of this policy, so getting them properly trained is absolutely essential. They need the skills to do more than just read a number; they need to be able to have sensitive, helpful conversations. If a manager sees a high score and their first thought is "disciplinary action," they've completely missed the point.
The training should really nail down a few key areas:
- Reading between the lines: A high score is a prompt for a chat, not a verdict.
- Leading with empathy: Teaching them how to use open questions to understand what’s really going on behind the absences.
- Knowing the legal side: Recognising when an absence might be linked to a disability and understanding the duty to make reasonable adjustments under the Equality Act 2010.
Ultimately, a manager’s job is to bring the human element that a raw score can never provide. This is often best done through consistent return-to-work interviews, which create a confidential space to talk about any underlying issues.
Know When to Bend the Rules
A rigid, "one-size-fits-all" approach to the Bradford Factor is a recipe for disaster. You have to build in some common sense and flexibility to handle genuine exceptions fairly.
A fair policy isn't about treating everyone exactly the same. It's about giving every individual the support they actually need, which sometimes means making exceptions for serious health issues or protected characteristics.
Certain types of absence should always be handled with care and typically kept separate from the standard calculation. These include:
- Absence related to a known disability.
- Pregnancy-related sickness.
- Time off for dependents or bereavement leave.
- Absences caused by a work-related injury.
Ignoring these situations isn't just bad for morale; it could land you in legal hot water. By tracking these absences separately, you can manage them supportively without unfairly driving up an employee's score. It’s also worth thinking about prevention – exploring innovative workplace wellness program ideas can help you tackle some of the root causes of absence before they become a problem.
This kind of balanced approach is more important than ever. After years of stability, UK sickness absence rates have climbed since the pandemic, with stress and mental health issues now being major factors. A 2023 survey found the average sickness absence rate hit 4%, a significant jump. Given this backdrop, a supportive and flexible policy isn't just nice to have; it's a necessity.
Got Questions About the Bradford Factor? We've Got Answers
As more companies start using the Bradford Factor to get a handle on absence, it’s only natural that questions pop up. Whether you’re an employer thinking about rolling out a policy or an employee who’s being managed by one, getting your head around the details is key.
Think of this as your go-to guide for the most common queries. We want to cut through the confusion and show how this tool is meant to work – as a way to spot problems and offer support, not just to penalise people.
What’s Considered a “High” Bradford Factor Score?
This is usually the first thing people want to know. The short answer is, there’s no magic number set in stone. What’s considered ‘high’ really comes down to the company, its policies, and how much disruption short-term absences cause.
That said, a general pattern has emerged across many UK workplaces.
- A Nudge for a Chat: A score creeping up to around 200-250 is often the point where a manager might have an informal word, just to check in.
- Time for a Formal Review: If a score hits 500 or more, it’s usually seen as a serious concern. This will likely trigger a more formal meeting, probably with HR involved.
It's important to remember these are just triggers, not punishments. They’re simply signposts for managers to step in and see what's going on.
Can You Be Sacked Just for a High Score?
Let’s be crystal clear on this: absolutely not. A high Bradford Factor score, by itself, is never enough to justify firing someone. It isn’t a disciplinary tool.
A high score is a starting pistol, not a finishing line. It kicks off a process where managers need to understand the 'why' behind the absences and offer support.
Dismissal can only ever happen after a full, fair, and documented process. This would have to include formal warnings, a proper investigation into the reasons for absence, and clear evidence that the company has tried to help the employee. The score is just the thing that gets the ball rolling on proper HR procedures.
What About Disability-Related Absences?
This is a really important point. The Equality Act 2010 places a duty on employers to make "reasonable adjustments" for disabled staff. Applying the Bradford Factor blindly to absences related to a disability could easily be discriminatory.
Because of this, good practice – and any fair policy – is to treat these absences differently. Most companies will either exclude disability-related sick days from the calculation entirely or at least track them separately. This ensures the system doesn't unfairly penalise people for health conditions they can't control.
How Is This Different to Just Counting Sick Days?
The real difference is that the Bradford Factor focuses on the pattern of absence, not just the total time off.
If you just count the days, one employee off for a single ten-day spell looks the same as another employee who’s had ten separate one-day absences. Both add up to ten days.
But the Bradford Factor’s formula, which squares the number of separate absences, gives far more weight to the second pattern. It’s built to highlight the massive disruption that frequent, unplanned, short-term absences cause – something a simple day count completely misses.


