
Understanding The Bradford Factor Formula That Actually Works
Let's cut through the jargon. At its core, the Bradford Factor calculation is a simple formula designed to highlight a specific type of problem: the operational chaos caused by frequent, short-term absences. Imagine having to find cover for a team member every other Friday versus planning for one single, two-week absence. The disruption level is completely different, and that's precisely what the formula is built to measure.
First developed in the 1980s, it has become a standard tool in UK workplaces for focusing on the disruptive nature of frequent, brief absences over longer, continuous ones. If you want to dive deeper into its origins and use, you can find more information by exploring insights on how the Bradford Factor works.

The formula itself looks straightforward: B = S² × D.
- ‘B’ is the final Bradford Factor score.
- ‘S’ stands for 'spells', which is the number of separate instances of absence.
- ‘D’ is the total number of days the employee was absent.
The real magic happens when you square the spells (S²). This mathematical step intentionally gives more weight to the frequency of absence. A single long absence will always produce a low score, while multiple short absences—even for the same total duration—will see the score climb exponentially. This is the key to a proper Bradford Factor calculation; it’s designed to penalise the pattern, not the person.
Why Squaring The Spells Is So Crucial
To truly get your head around this, let's compare two employees. Both have taken 10 days of sick leave over the past year, but their patterns are worlds apart. A quick look at the table below makes the impact of the formula crystal clear.
This side-by-side comparison shows how two employees with the same total days off can end up with dramatically different scores, revealing a lot about potential workplace disruption. This comparison is a core part of what makes our guide to the Bradford Factor score calculator so practical for managers.
Bradford Factor Score Comparison Examples
Side-by-side comparison showing how different absence patterns result in dramatically different Bradford scores
| Employee | Absence Pattern | Spells (S) | Days (D) | Calculation | Bradford Score |
|---|---|---|---|---|---|
| Sam | One instance of illness lasting two weeks | 1 | 10 | (1 x 1) x 10 | 10 |
| Alex | Ten separate single-day absences throughout the year | 10 | 10 | (10 x 10) x 10 | 1,000 |
As you can see, Alex's score is a massive 100 times higher than Sam's, despite them both being absent for the same total number of days. This isn't about judging who was "more ill." Instead, the Bradford Factor calculation gives HR managers and small business owners a numerical value that reflects the administrative headache and operational strain caused by Alex's ten separate unplanned absences.
Walking Through Real Bradford Factor Calculations
Theory is one thing, but applying the Bradford Factor calculation to real-world employee scenarios is where you truly see its power and potential pitfalls. Let's move beyond the basics and work through some examples that reflect the messy reality of managing a team. These aren't just numbers; they represent genuine situations you'll likely face.
This simple infographic visualises the three core components of any Bradford Factor calculation: counting the instances, summing the days, and applying the formula.
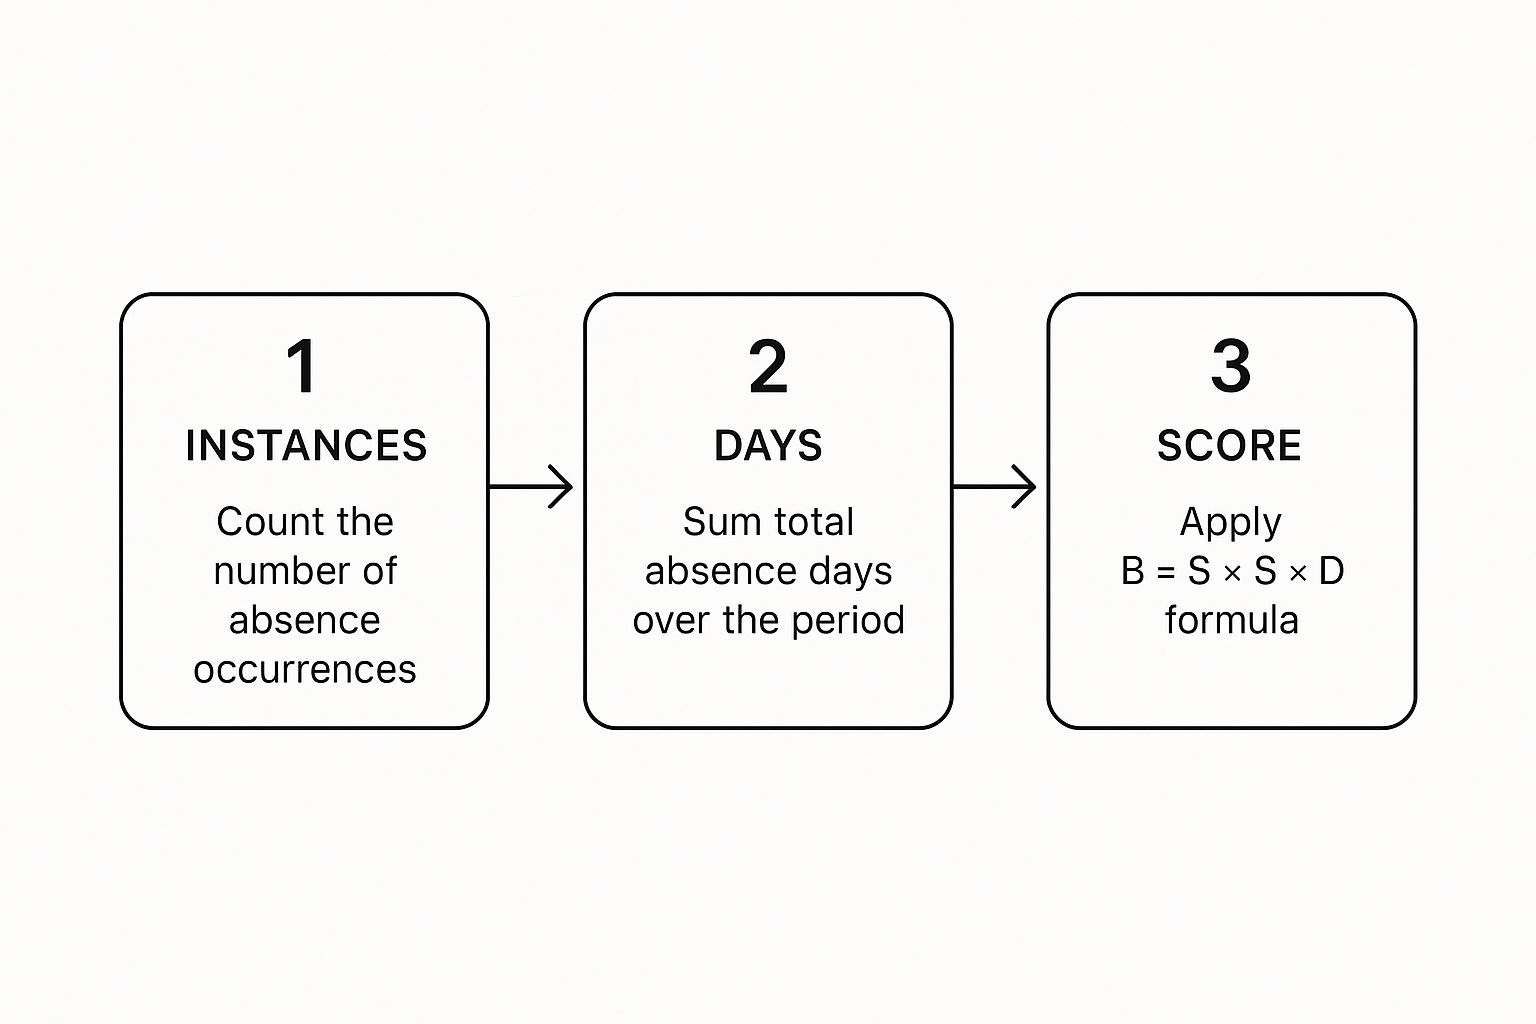
It clearly shows how the frequency of absences (spells) is the most influential factor, leading directly to the final score. Now, let’s see this process in action.
Scenario One: The Occasional Flu
First up, we have David. He caught a nasty flu and was off work for a full working week.
- Employee: David
- Absence: One single period of illness that kept him out for 5 consecutive days.
- Spells (S): 1 (it was one continuous event)
- Days (D): 5
- Calculation: (1 x 1) x 5 = 5
David’s score is exceptionally low. This is a classic example of how the Bradford Factor correctly identifies that a single, longer absence is not as operationally disruptive as frequent, sporadic ones. A score of 5 would typically require no action at all from a manager.
Scenario Two: The Recurring Monday Issue
Now let's look at Maria. She's also been off for a total of five days over the year, but her pattern is very different.
- Employee: Maria
- Absence: Took a single day off on four separate Mondays and one Friday.
- Spells (S): 5 (each absence is its own 'spell')
- Days (D): 5
- Calculation: (5 x 5) x 5 = 125
Notice that Maria and David were both absent for the same number of days. However, Maria's score of 125 is 25 times higher than David's. This significant difference is exactly what the Bradford Factor is designed to highlight. A score like this often serves as a trigger point for an informal conversation to understand if there are underlying issues.
This screenshot from Wikipedia shows a typical trigger point table, which many UK companies adapt for their own absence policies.
The table clearly defines score ranges that correspond to specific managerial actions, from a verbal warning to a final written warning, providing a structured approach.
Scenario Three: Handling Half-Days
What about half-day absences? This is a common point of confusion. The standard practice is to count any absence during a day, whether for an hour or the full shift, as one 'spell'. However, for the total days (D), you should use the actual time lost.
Let's take Chloe's situation as an example.
- Employee: Chloe
- Absence: Three separate half-day absences for appointments.
- Spells (S): 3
- Days (D): 1.5 (3 x 0.5 days)
- Calculation: (3 x 3) x 1.5 = 13.5
Even with three separate instances, the low number of total days keeps Chloe's score very low. It’s crucial to be consistent in how you record these partial absences to ensure every Bradford Factor calculation is fair and accurate across the team.
Why These Numbers Actually Matter For Your Business
Behind every Bradford Factor calculation lies a story about your team and your company's bottom line. It’s tempting to see the score as just another HR metric, but its real value comes from a simple workplace truth: frequent, short-term absences are far more disruptive than a single, longer leave. Just think about it from a manager's point of view. Arranging cover for an employee taking a two-week holiday is fairly straightforward. But scrambling to reassign tasks for the fifth time in a quarter because someone is off for a single day creates genuine operational chaos.

This isn’t just a feeling; it’s backed by data. UK workplace statistics consistently show that short, frequent spells of absence make up a huge chunk of lost working days. In 2023, the average absence rate was around 4.3%, and of that, approximately 30% of all absences were short-term, lasting less than a week. This pattern shows why a tool like the Bradford Factor is so useful—it helps you pinpoint where the most significant disruption is coming from. You can get a deeper understanding by exploring absence trends and their impact on UK businesses to see the complete picture.
What the Scores Mean in Practice
The score itself isn't a judgement on an employee's character but an indicator of the impact on day-to-day operations. The best managers I've worked with use these scores to start a conversation, not to wield a disciplinary hammer.
Here’s a practical breakdown:
- Low Scores (e.g., below 50): This usually points to an employee with fantastic attendance or perhaps one genuine, longer spell of illness. From a management perspective, there’s nothing to worry about here.
- Moderate Scores (e.g., 50-200): This range often serves as a trigger for an informal chat. It’s a chance to ask, "Is everything okay?" This simple question could uncover underlying issues, like a need for more flexible working arrangements or a health concern that requires support.
- High Scores (e.g., above 200): A consistently high score flags a more significant problem. This is where the real costs start to add up—from paying overtime to cover shifts to project delays and a dip in team morale. At this stage, a formal review is often necessary to address the pattern and its effect on the team and the wider business.
Ultimately, a forward-thinking employer uses the data from a Bradford Factor calculation not to punish but to understand. It gives you the insight to spot a potential problem early, offer support where it’s needed, and stop a small issue from spiralling into a major operational headache that affects everyone.
Building Your Bradford Factor Tracking System
Setting up a system to monitor your team's Bradford Factor calculation doesn't require an immediate investment in a fancy, all-singing, all-dancing HR suite. For many smaller businesses, the journey can start with something as simple as a well-organised spreadsheet. The secret is to create a system that can grow alongside your company.
From Spreadsheets to Software
For a small team, a straightforward Excel or Google Sheets template is often the perfect place to start. The key is structuring it correctly from the get-go. You'll need dedicated columns for:
- Employee Name
- Absence Start Date
- Absence End Date
- Total Days Absent (D)
- A running count of individual Spells (S) over a rolling 52-week period
This hands-on approach is budget-friendly and gives you total control. However, as your team gets bigger, it can quickly turn into an administrative nightmare. Keeping the spell counts and the 52-week rolling period accurate for every employee becomes a chore, and it's easy for human error to creep in. This is typically the tipping point when businesses realise they need a more automated solution. When looking to build out your system, it's worth exploring various document automation software which can make collecting and reporting data far less manual.
Integrated HR Systems: When Is It Worth It?
As your business grows, dedicated absence management software like LeaveWizard becomes a genuine lifesaver. These platforms handle the Bradford Factor calculation for you, automatically. When an employee logs their absence, the system takes care of the rest—it updates their total days absent, increases their spell count, and recalculates their score instantly.
The true value here isn't just in the automation; it's the consistency and clarity it brings. The rules are applied equally to everyone, and managers can spot potential attendance issues with a quick glance, without needing to sift through spreadsheets. This frees up their time to focus on the human element of management—having supportive conversations with their team—rather than getting stuck in the weeds of manual calculations.
Maintaining Accurate and Compliant Records
No matter which system you opt for, data accuracy is absolutely crucial. You must have a clear, documented policy for how absences are reported and logged, especially for less straightforward situations like half-days or phased returns to work.
Remember, this information is sensitive personal data. Your tracking system, whether it's a spreadsheet on a secure drive or a dedicated software solution, must be protected and comply with UK GDPR regulations. Access should be restricted to authorised personnel only, and the records should be used solely for managing attendance fairly and consistently. It's also a smart move to provide brief, regular training for your managers on using the system properly to ensure fairness across the entire organisation.
Turning Bradford Scores Into Meaningful Action
Getting a number from a Bradford Factor calculation is the easy part. The real skill lies in turning that number into a supportive and productive conversation. A high score isn't an automatic trigger for disciplinary action; it's a signal that something needs your attention. The most successful UK organisations I've worked with use this data not as a hammer, but as a key to unlock a conversation and get to the root cause of an absence pattern.

While its exact origins are a bit of a mystery, the Bradford Factor is often traced back to UK industrial psychology research in the 1980s. Despite its hazy beginnings, it was adopted by major public bodies like the HM Prison Service as early as 2001, proving its value as a management tool. You can read more about the history of the Bradford Factor on Wikipedia. This history shows its role as a long-standing method for analysing absence patterns, not just penalising staff.
Setting Fair And Effective Thresholds
Your first task is to establish clear trigger points that make sense for your business. These thresholds aren't one-size-fits-all; they need to reflect your company culture, operational needs, and what you're trying to achieve. A tiered system is a common and effective approach:
- Informal Chat (e.g., Score of 150+): This is a low-key, supportive check-in. The goal is simply to ask, "Is everything alright?" It’s a chance to show you care and to find out if there are underlying issues, like stress or personal problems, where the company might be able to offer support.
- Formal Review (e.g., Score of 400+): When a score reaches a more serious level, a formal meeting is warranted. This conversation will be more structured, focusing on the impact the absences are having on the team and business. You can then explore practical steps to improve attendance together.
- Final Warning (e.g., Score of 800+): This stage is for persistent, unresolved issues where previous support hasn't led to improvement. The conversation here needs to clearly outline the serious consequences of continued high absence rates.
For a more detailed look at setting these levels, our guide on Bradford Factor trigger points offers some very practical advice.
Presenting Data For Productive Conversations
How you present the data matters. A lot. Instead of just dropping a score on the table, try to show the pattern visually. A simple calendar view highlighting absence days can make the impact of frequent, short-term absences much clearer than a single number ever could.
Learning how to build a simple but interactive dashboard can be a game-changer for these discussions. This Excel dashboard tutorial is a great place to start. A visual approach helps shift the focus from a cold, punitive score to a shared understanding of the operational disruption. This transforms the Bradford Factor calculation from a metric into a collaborative problem-solving tool, helping to create a culture where good attendance is a shared responsibility.
Common Bradford Factor Mistakes and How to Dodge Them
Even though the Bradford Factor formula looks straightforward, it's surprisingly easy to get the calculation wrong. These small errors can lead to unfair scores for your team and completely skew your absence data. One of the most common trip-ups I’ve seen is misunderstanding what counts as a ‘spell’ of absence.
I’ve witnessed managers record two consecutive sick days as two separate spells. This simple mistake wildly inflates the final score and paints a very misleading picture of disruption. Remember, a spell is one continuous period of absence, whether it lasts for a single day or ten.
This mistake is particularly damaging to employee morale and undermines the fairness of the entire system. For instance, imagine an employee is off sick on a Friday and the following Monday for the same illness. That's one spell lasting two days. Recording this correctly gives a score of 2 ((1×1)x2). However, if you misinterpret it as two separate spells, the score skyrockets to 8 ((2×2)x2). That’s a 400% difference stemming from a simple logging error.
Getting the Details Right
Another frequent error is handling complex situations inconsistently. A classic example is the phased return to work, where an employee might work half-days for a week after an illness. How do you log this time? Best practice is to treat the entire phased return period as part of the original sickness spell. It shouldn't be logged as new, separate absences, which would unfairly penalise an employee who is responsibly managing their return to full duties.
Furthermore, failing to discount legitimate, pre-approved absences is a significant pitfall. Absences for reasons like disability-related appointments, dependents’ leave, or approved compassionate leave should never be included in a Bradford Factor calculation.
Including these not only risks discriminating against employees with protected characteristics but also erodes trust in your absence management process. It's vital to have a clear policy that separates unplanned sickness from other forms of approved leave. For a deeper look at creating these distinctions, our guide on managing employee absences offers some practical frameworks.
Ultimately, accuracy and consistency are your best friends here. A reliable system, whether it’s a detailed spreadsheet or automated software, combined with clear training for managers, ensures the Bradford Factor remains a fair and useful tool for identifying problematic patterns, not for creating them.
Your Bradford Factor Implementation Roadmap
Putting the theory into practice is the final, and most important, part of getting to grips with the Bradford Factor calculation. A successful launch depends on a clear, well-organised plan that respects both your company's needs and your employees. Thinking about this like you would any other major task and using something similar to a solid project plan template can really set you up for success.
Your first move should be to focus on open communication and establishing achievable goals.
Setting Up For Success
Here's a quick checklist to get you started on the right foot:
- Define Your Trigger Points: You need to decide which scores will lead to an informal chat, a more formal review, or a final warning. Get these written down clearly in your absence policy so there's no confusion.
- Communicate the Policy: Don't just rely on a company-wide email that might get missed. Organise a team meeting to explain what the Bradford Factor is, why you're bringing it in, and how it will be used fairly across the board. It's crucial to stress that it's a supportive tool, not a way to punish people.
- Train Your Managers: Your line managers will be dealing with this day-to-day. They need to completely understand the calculation, know the trigger points inside-out, and be trained on how to have supportive, helpful conversations with their team members.
A Realistic Timeline
Trying to do everything at once is a recipe for disaster. A phased approach is always best. Plan for about 3-4 weeks for the initial setup, which includes getting the policy defined and running training sessions for your managers.
After that, give the system another 90 days to gather data before you start holding any formal review meetings based on the scores. This gives everyone a fair chance to get used to the new system and shows that you're being reasonable.
By rolling out your policy in a methodical way, you create a system that genuinely helps with employee well-being and makes your workplace more reliable. If you're looking for a system that automates these calculations and makes the whole process easier, it's worth exploring what LeaveWizard can offer your business.


